In the field
Field-operations system for river rehabilitation.
A field team was planning river rehabilitation on paper — litter collection, weeding, planting and admin across many river sections — with no clear view of who did what, where, or what it all added up to. I built a platform that helps them plan the work, log the day, and see the impact they're making.
Django 6 · Python · PostgreSQL · Leaflet · vanilla JS — in active production use.
Rehabilitation of the Liesbeek River is coordinated by a small field team running litter collection, weeding, planting, and administrative work across many river sections. Work was planned on paper; there was no single source of truth for who did what, where, or what the cumulative impact had been. Managers couldn't see progress, and reporting was manual.
A purpose-built web platform that helps the team plan, track, and measure their work — from "which section do we work today" to "how many bags have we pulled out of the river this year".
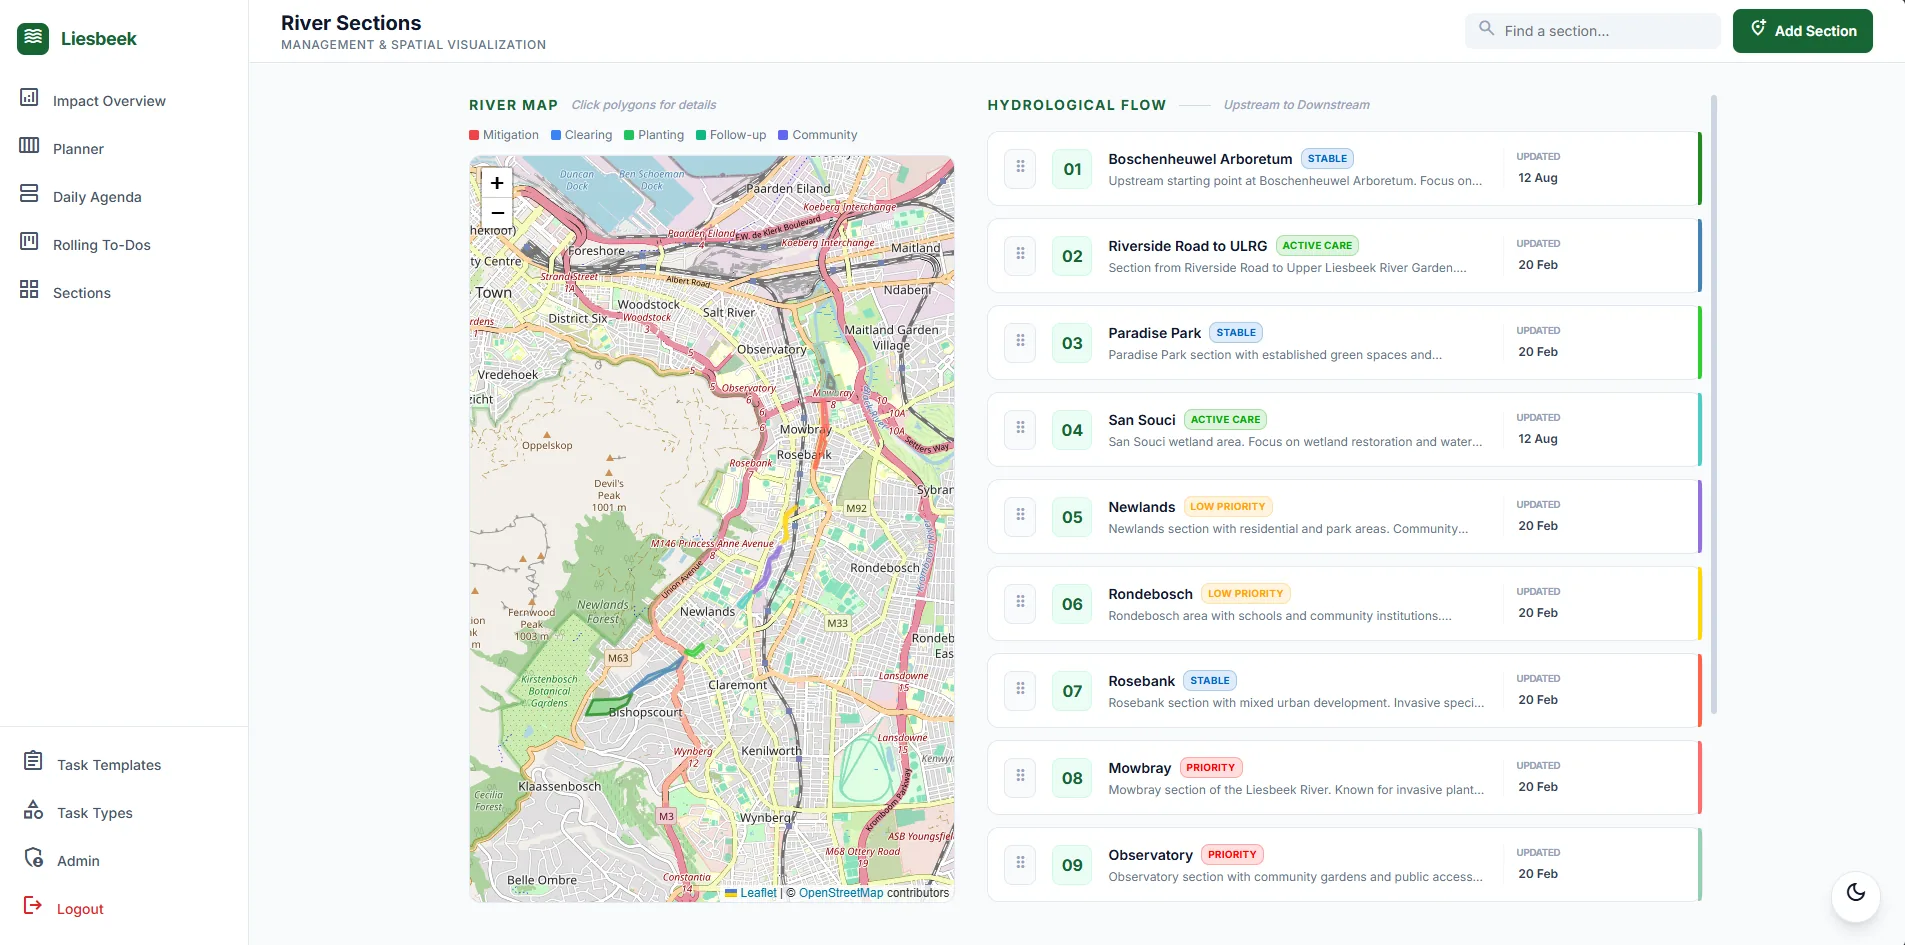
Interactive Leaflet map with polygon drawing. Each section holds a GeoJSON boundary and centre point; map hover syncs with the section list. Sections move through lifecycle stages — Mitigation → Clearing → Planting → Follow-up → Community.
Weekly planner (7-day, split by Team / Manager / Chairperson), monthly calendar, and a daily agenda with tick-to-complete. 19 real-world task templates auto-populate instructions, and tasks can span multiple days via series.
Smart forms that adapt to the task type: litter runs capture general + recyclable bag counts; weeding captures species-specific removals with quantities; planting captures species-specific counts; admin stays clean. Notes auto-fill from the task, and photos attach with descriptions.
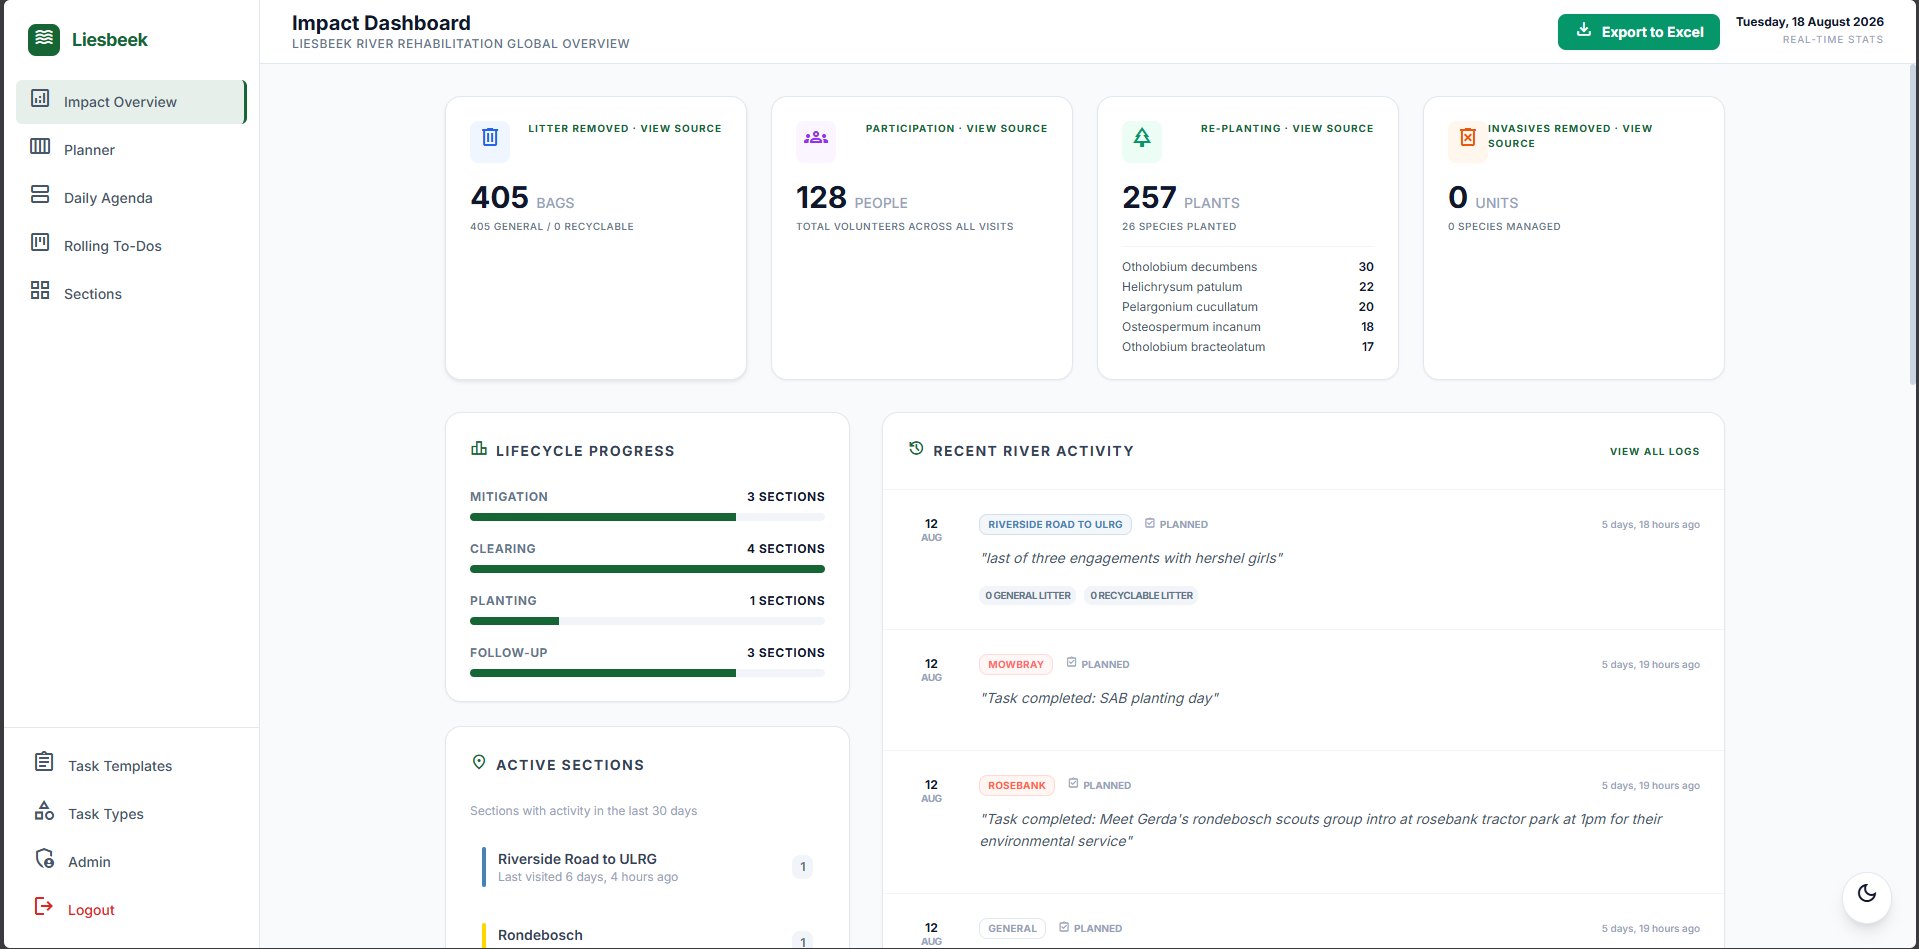
Global metrics — total bags collected, plants planted, weeding sessions — plus cross-section comparisons, recent activity, and drill-down into each metric's source logs.
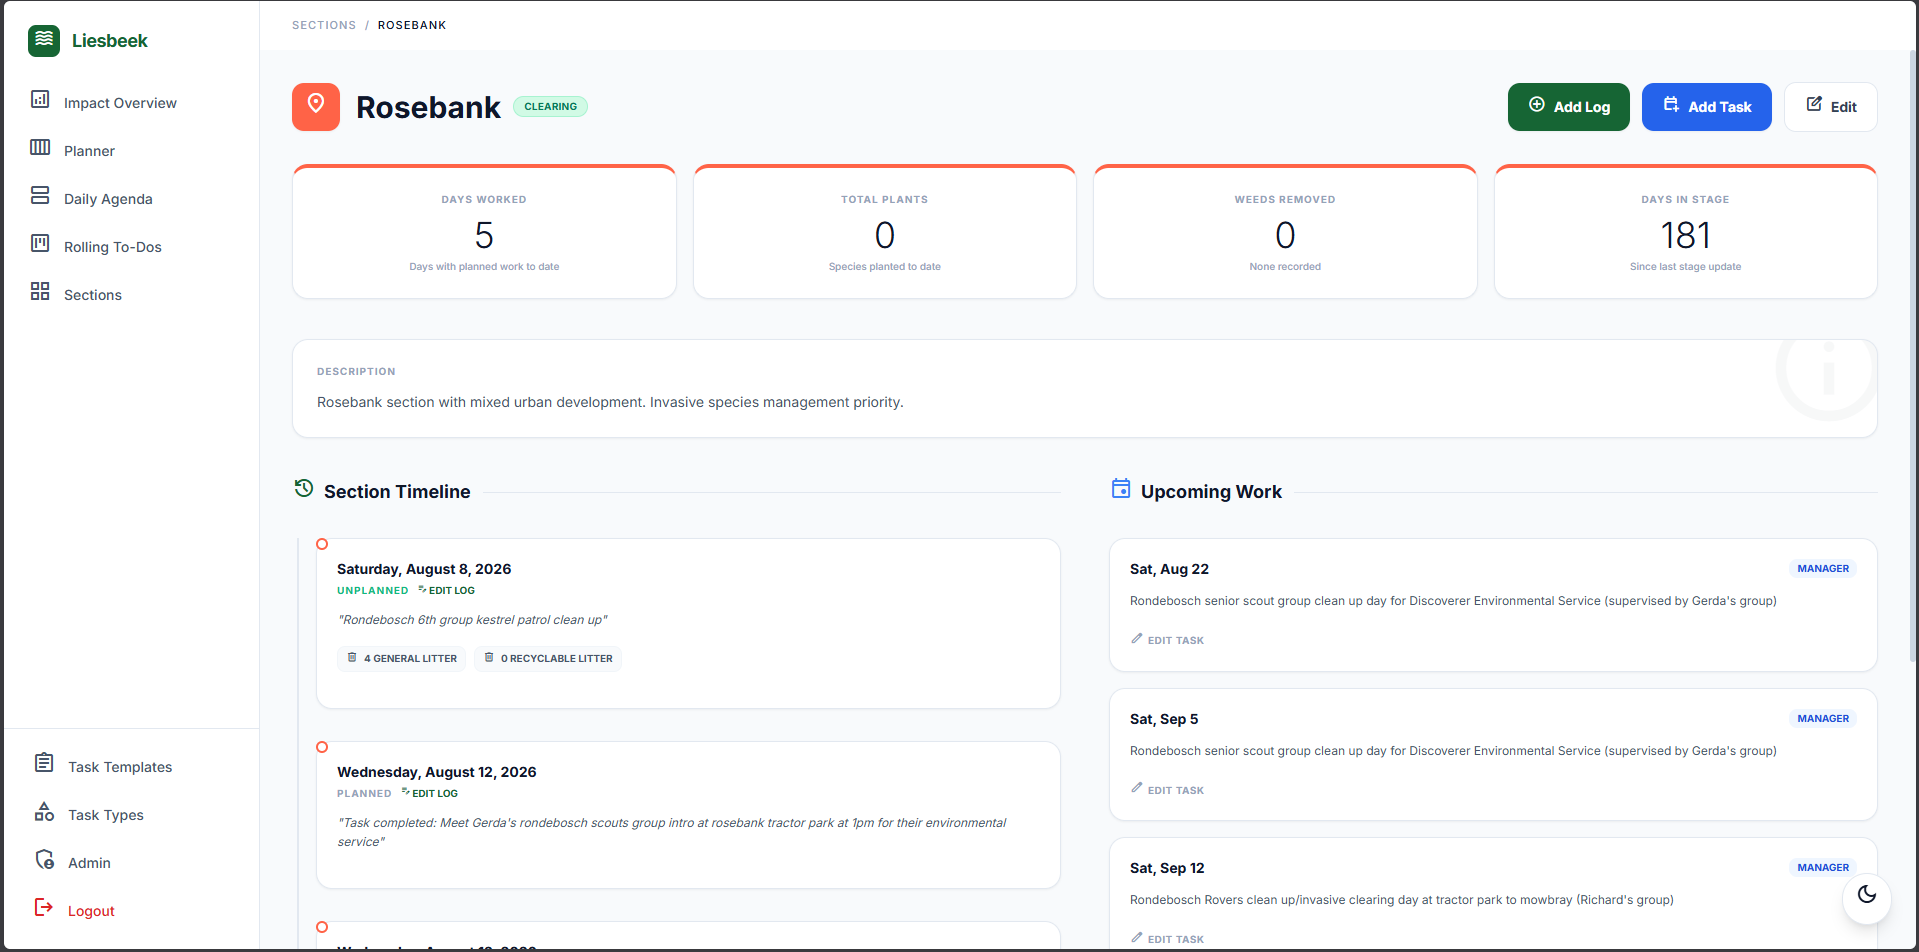
Timestamped lifecycle history per section, with a timeline view of rehabilitation progress.
Drag-and-drop rolling to-do board (To Do / Doing / Done) with position re-indexing.
Multi-sheet workbook export (sections, tasks, visit logs), plus planner and filtered activity-log exports.
Every view adapts to mobile — including Kanban drag-and-drop and form controls — so it works on a phone at the river.
services/, not in views or models; views only route and prepare context.bulk_create/bulk_update over save-in-a-loop, select_related() on every list view to kill N+1 queries, and .values()/.only() for read-only rendering — enforced with automated N+1 growth tests.Team, Manager, and Chairperson assignee types, each with their own planner rows.
Django 6 · Python · PostgreSQL (production) / SQLite (dev) · Django templates · Leaflet.js · vanilla JavaScript · Sentry.